Fundamentals of Technical Analysis

You might not think about it like this, but stocks and companies are very different things. That’s an important, but often overlooked, distinction.
Technical Analysis and the Stock Market –
It’s possible to have a great stock associated with a lousy company. That’s a fairly common occurrence in the stock market where a company with no earnings can trade at a high price for an extended period of time. Sometimes, the company grows into its valuation. At other times, the optimism proves to be extreme, and the stock price collapses.
The opposite conditions can also be found with great companies being lousy stocks. These are often large companies with solid fundamentals. But they may be in slow-growing sectors. Great companies may offer a significant dividend but the stock price reflects the slow growth and these stocks often lag the market.
Sometimes, it can be difficult to distinguish between great companies and lousy companies. CEOs of bad companies often tout a turnaround, and sometimes they’re right. CEOs of great companies may see bright futures when competition is lurking.
For more information checkout our Technical Analysis Course.
Technical Analysis Can Help Investors Solve Their Problems

To solve this problem, investors can ignore the company. Since we are buying and selling stocks, it makes sense that we should focus on the stock. Technical analysis is the form of investment analysis dedicated to analyzing the price history of stocks. Technical analysis can also be applied to cryptocurrencies, futures or any other financial market.
What is the definition of Technical Analysis?
A formal definition of the field of study is, “Technical analysis is the extraction of information from market data into objective visualizations through the use of mathematics with an emphasis on investor behavior and supply and demand to explain the current and anticipate the future path of the financial markets.”
Less formally, “Technical analysis is the study of market data to forecast future trends in prices.”
Technical analysis applies three fundamental principles; How to make Technical Analysis Forecasts?
● The current market price is determined by supply and demand. When supply exceeds demand because sellers are acting with
more urgency than buyers, prices fall. When demand exceeds supply, prices rise. Although there will often be a story to explain why buyers or sellers are acting with greater urgency, the story is less important than the factors of supply and demand.
● Price moves in trend. This can be seen in long-term charts of major stock markets which have a persistent uptrend over decades. Trends also exist in smaller timeframes from intraday price action to price charts spanning months. Prices can move in uptrends or downtrends for extended periods of time. They can also form a sideways trend where price makes little progress up or down.
● History tends to repeat itself. Although history won’t repeat exactly, the emotions of investing create general patterns and emotional responses have remained fairly constant over many centuries.
These principles are applied by technical analysts with fundamental tools that include charts, indicators and general theories.
NYIF’s offer’s comprehensive technical analysis training. Check out course material for free.
Technical Analysis Methods; What are Technical Analysis tools?
The primary tool of technical analysts is the price chart. Charts have been used for hundreds of years. They are simply a visual depiction of the price action. Although there are several types of charts, price trends are identifiable on any of them. In addition to trends, analysts can spot patterns. Based on history, an extensive catalog of patterns has been identified and can be used to inform trading decisions.
What are Technical Analysis Indicators?
Indicators generally help analysts identify the direction and strength of the trend or measure the momentum of the recent price action. These tools can allow for objective definitions of the trend and form the basis of simple quantitative trading strategies.
How does Technical Analysis Work?
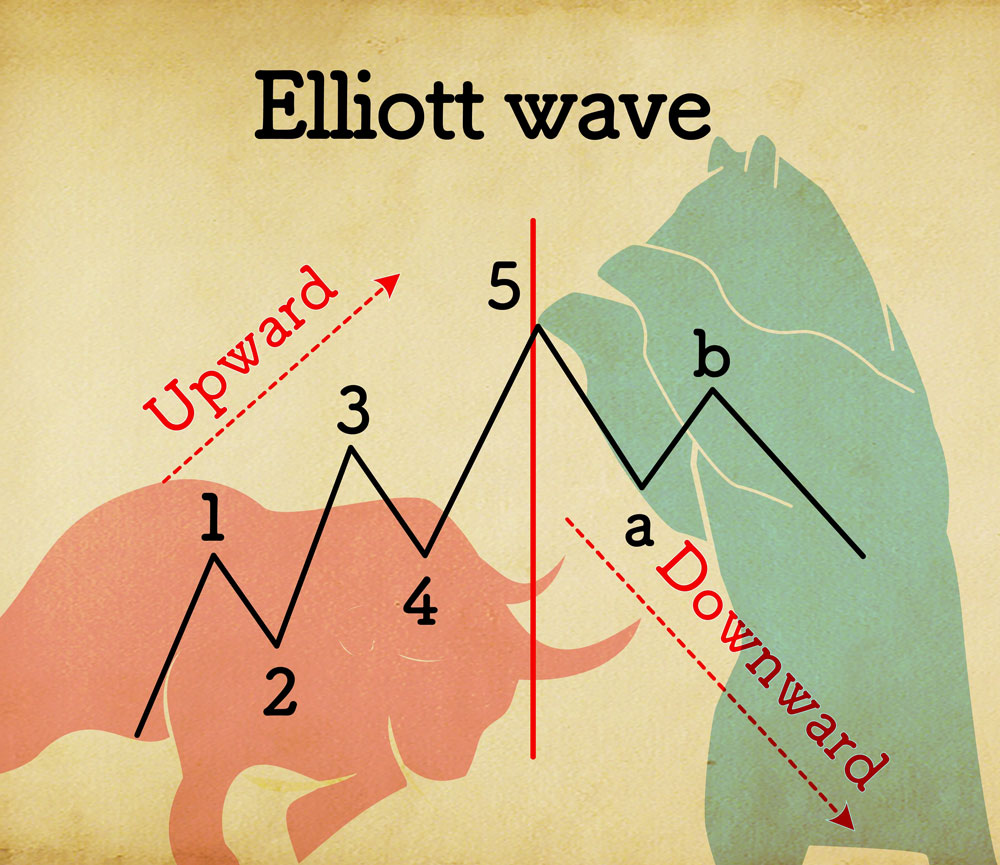
General theories are used by some analysts as a roadmap of what to expect. Dow Theory or Elliott Wave can help trading professionals define where they seem to be in the market cycle. With that knowledge they can develop a trading strategy for the future.
Knowledge of these fundamentals can be used to create a complete trading strategy or to supplement the fundamental analysis of stocks.
Technical analysis offers trading professionals the option of applying rigid rules or taking a subjective view of the market based on history. With either approach, a variety of tools can be adapted to the trader’s objectives and preferred timeframe.
How to Learn Technical Analysis?
The New York Institute of Finance offers an in depth training Trading - Fundamentals of Technical Analysis Course.
You will learn Learn;
● How to Use Technical Indicators; Moving averages, RSI indicator, Stochastic Rate of change (RoC) indicator, and MACD Bollinger bands.
● How to Design and a trading strategy, Results for popular indicators.
● Technical Analysis Methods; Sentiment (CBOE volatility index (VIX), surveys, insider buying and selling), Breadth (advance decline, % stocks above a moving average)
● Relative Strength Trading; Comparative relative strength (momentum anomaly to the Efficient Market Hypothesis)
● Combining relative strength with fundamentals (value anomaly to the Efficient Market Hypothesis)
● Advanced Technical Analysis Theory; Dow theory, Cycle analysis, Elliott wave theory, Fibonacci sequence, and Intermarket analysis
Upon course completion you’ll receive Certificate in Trading - Fundamentals of Technical Analysis from the New York Institute of Finance. This course is offered Self-paced, Virtually, and In-person.
About the New York Institute of Finance (www.nyif.com)
The New York Institute of Finance was formed more than 100 years ago by the New York Stock Exchange and is a global leader in delivering education and training for the financial services industry. The Institute offers a vast array of courses ranging from introductory to advanced, as well as several professional designations that build careers through expertise. Each year the Institute delivers training to more than 50,000 individuals in over 125 countries.
For more information about NYIF, visit nyif.com.
Contacts
New York Institute of Finance
+1 347-842-2501
customerservice@nyif.com
SOURCE New York Institute of Finance
Related Links
https://www.nyif.com